-
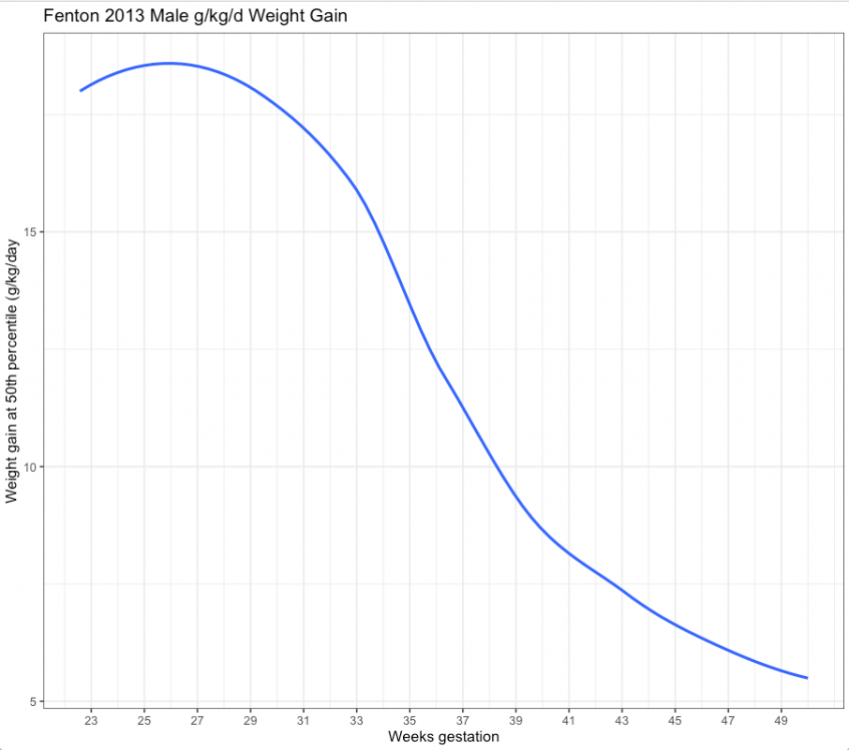
(If anyone has noticed me posting and deleting things, it's because I should not try to do calculations post-call. Apologies for any confusion.) After several mistakes on my part, this should be the correct shape of the smoothed "g/kg/day" weight gain of a male preterm infant maintaining the 50th percentile on the Fenton 2013 preterm growth charts.
-
Very nice! Ahh, the benefits of having a proper national registry... I'm quite envious, especially with the ability to smoothly follow from extreme prematurity through 24 months on a single chart. Do you need to use the visual chart to estimate percentiles / Z-scores of measurements, or is there a way to calculate precise numbers? Some other growth charts use parameterization (e.g., Cole's "lambda mu sigma (LMS)" parameterization, or the INTERGROWTH-21's use of the "skew t-distribution") to allow calculations. I didn't see equations in the Swedish growth reference to facilitate those calculations.
-
I'm curious what preterm (or infant) growth charts are in typical use in your part of the world? I'm a neonatologist in the U.S. and my personal observation is that local U.S. East coast practice seems to use primarily the Fenton 2013 and Olsen 2010 intrauterine growth charts as targets for extrauterine growth. (For infants and children, it's a mixture of WHO and U.S. CDC charts.) I maintain a set of freely accessible web-based growth chart calculators (PediTools) which have been generally popular (~600,000+ page views per month) but have noticed that my primary traffic is from North America. This leads me to wonder whether other parts of the world use different growth charts for their preterm babies, and what tools they use to determine percentiles / Z-scores? And if there aren't satisfactory tools already available, whether I should look into making available other growth charts? Anyone care to share their thoughts?
-
 Full disclosure -- I am the developer of this (and other) clinical decision support web-based calculators on https://peditools.org/
 -
Calculator and clinical decision support for the AAP 2022 guidelines for the management of hyperbilirubinemia in newborns 35 or more weeks of gestation. Features Identifies appropriate gestational age risk curve Analyzes for neurotoxicity risk factors absent, present, or both Calculates difference between bilirubin measurement and phototherapy threshold Flags when a TcB should be confirmed with a TSB Provides post-discharge follow-up decision support Supports both 72 and 366 hour plots Supports plotting of multiple time points, to assess trends Calculates rate of increase between last two measurements Calculates age from dates of birth and measurement
View in the app
A better way to browse. Learn more.